Posted by Hire4eventIndia on 23 June 2026 in English.

Mapping Contribution Update
This diary entry shares general mapping observations and location verification work in the Noida region, Uttar Pradesh.
Field Observation
During mapping review, I focused on verifying real-world location accuracy, including nearby office buildings and infrastructure details.
Notes
- Verified coordinate accuracy for mapped location points
- Observed surrounding road connectivity and nearby structures
- Ensured alignment with real-world geography data
Mapping Focus
- Improving location accuracy
- Supporting clean and structured map data
- Ensuring correct placement of points of interest
Reference Link
Code Example (Mapping Tag Format)
node
  amenity=office
  name=Hire4event


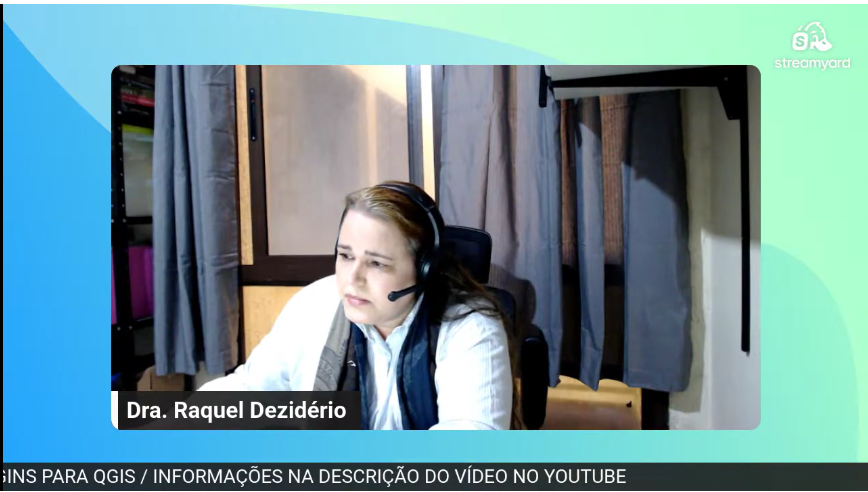 Dr. Raquel Dezidério Souto leading Session 3 of the Ciclo de Oficinas OSM 2026. The files used in Workshop 3 can be found in the video description.